
5CO02 Evidence-based Practice: Task One
Table of Contents
CIPD 5CO02 Evidence-based Practice Task Two
Q8. Table 1 Calculations (AC 2.1)
The raw data from Table 1, showing Technivara’s turnover and recruitment data for 2024, has been converted into percentage form for each department. This transformation is crucial for evidence-based practice, as percentages allow for a meaningful comparison of the relative impact of leavers, vacancies, and positions filled across departments of different sizes.
The completed calculations are presented in the table below:
| Department | Total Employees | Leavers | Leavers % | Vacancies | Vacancies % | Positions Filled | Positions Filled % |
| Quality control | 4 | 2 | 50.00% | 3 | 75.00% | 3 | 75.00% |
| Casting Department | 6 | 3 | 50.00% | 5 | 83.33% | 2 | 33.33% |
| Dispatch | 15 | 4 | 26.67% | 6 | 40.00% | 6 | 40.00% |
| Offices and Administration | 15 | 4 | 26.67% | 5 | 33.33% | 5 | 33.33% |
| Human Resources | 4 | 1 | 25.00% | 1 | 25.00% | 1 | 25.00% |
| Design | 12 | 3 | 25.00% | 5 | 41.67% | 2 | 16.67% |
| Sales & Marketing | 12 | 4 | 33.33% | 3 | 25.00% | 3 | 25.00% |
| Audio technical Department | 26 | 6 | 23.08% | 8 | 30.77% | 3 | 11.54% |
| Engineering | 35 | 8 | 22.86% | 8 | 22.86% | 3 | 8.57% |
| Research and Development | 8 | 1 | 12.50% | 4 | 50.00% | 4 | 50.00% |
Q9. Diagrammatical Presentation of Findings (AC 2.2)
The quantitative findings from the calculated data are presented using three different diagrammatical forms to aid visual interpretation and highlight key trends for Sue Young and the Board.
Diagram 1: Distribution of Total Employees (Pie Chart)
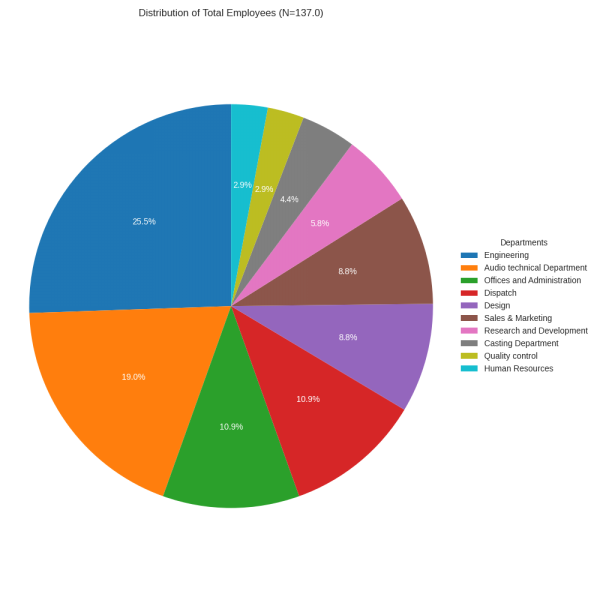
A pie chart illustrates the relative size of each department, which is necessary context for interpreting the other metrics. It shows that Engineering (23.33%) and Audio Technical Department (17.33%) are the largest departments, accounting for over 40% of the total workforce.
Diagram 2: Comparison of Key HR Metrics by Department (Grouped Bar Chart)
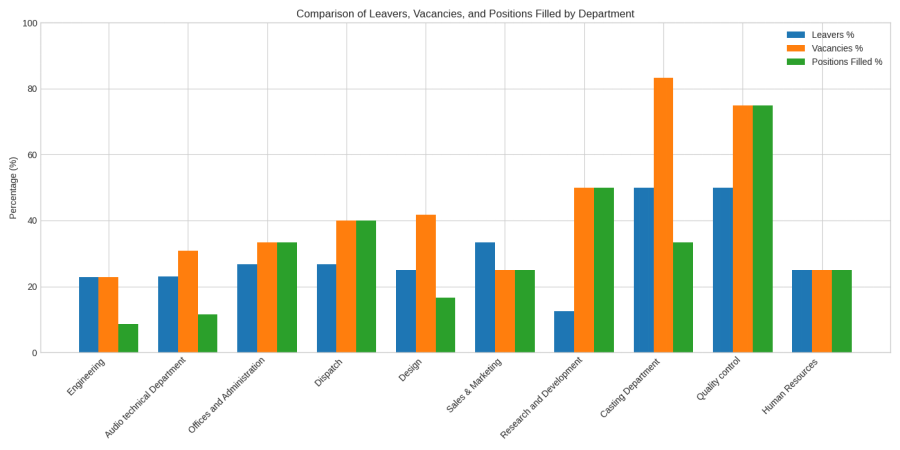
This chart compares the three key percentages (Leavers %, Vacancies %, Positions Filled %) side-by-side for each department, allowing for direct comparison.
Key Visual Findings:
- Critical Risk Areas: Quality Control and Casting Department show significantly higher percentages across the board, with Leavers and Vacancies reaching 50% and above, indicating a severe people practice crisis in these areas.
- Recruitment Lag: In several departments (e.g., Audio Technical, Engineering, Design), the Positions Filled % is markedly lower than the Vacancies %, indicating a major lag in Technivara’s recruitment process, a direct consequence of the “paper-driven” and “archaic” practices mentioned in the case study.
Diagram 3: Stacked View of HR Activity (Stacked Bar Chart)
The stacked bar chart provides a visual representation of the total HR activity (leavers, vacancies, and filled positions) as a percentage of the total workforce in each department.
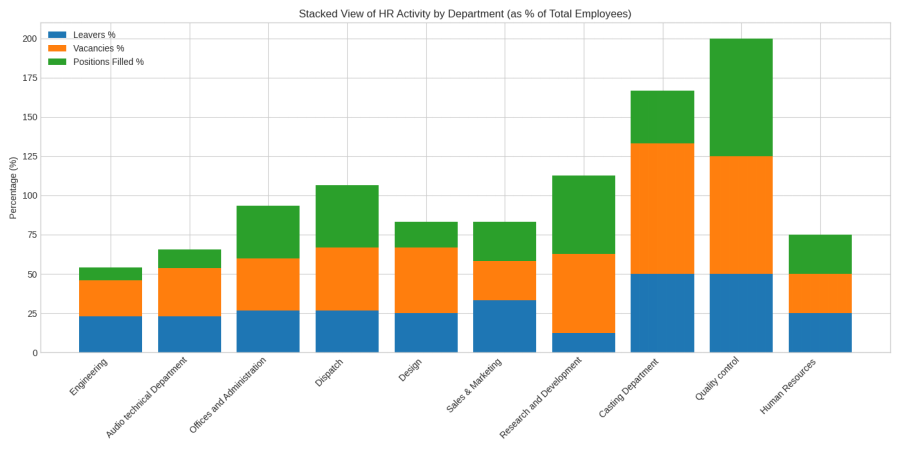
Key Visual Findings:
- Overall HR Burden: The chart clearly demonstrates that Quality Control and Casting Department require the most intensive HR intervention, with their combined activity percentages far exceeding other departments.
- Hidden Burden: The total height of the bars in departments like Dispatch and Research and Development also indicates a high level of churn and recruitment effort, even if their turnover rate is not the highest.
- 3CO04 Essentials of People Practice Example- Comprehensive Assessment Response
- CIPD 3CO03 Assignment Example: Core Behaviours for People Professionals – Assignment Responses
- Guide to Kotter’s 8 Step Model and Comparative Frameworks
- The Evolution of Language in the Age of AI: Analyzing the Impact of Large Language Models on Creative Writing
- Statistics Project Ideas: 50 Plus Topics for 2026
Beat Your Deadline
Hire a Writer Today!
✅ Get Your Assignment Done by Experts
Q10. Data Analysis Review and Recommendations (AC 2.3)
The analysis of the quantitative data (Table 1) and the qualitative L&D feedback (Table 2) reveals critical issues, challenges, and opportunities for Technivara, which must be addressed to support the planned expansion.
Review of Quantitative Data (Table 1)
The most pressing issue is the unsustainable turnover and vacancy rate in key operational departments.
- High-Risk Departments: Quality Control (50% turnover, 75% vacancy) and Casting Department (50% turnover, 83.33% vacancy) are in crisis. This level of churn in departments critical to the company’s product integrity and core manufacturing process poses a direct threat to the business’s reputation and operational stability. A Root Cause Analysis (RCA) is immediately required to diagnose the underlying issues (AC 1.2).
- Ineffective Recruitment Process: The data highlights a significant gap between vacancies and positions filled, particularly in the largest departments like Engineering (8 vacancies, only 3 filled; 8.57% filled rate) and Audio Technical (8 vacancies, only 3 filled; 11.54% filled rate). This confirms Sue’s concern that the “paper-driven” recruitment process is inadequate for meeting the demands of a growing business.
Review of Qualitative Data (Table 2: L&D Evaluation)
The L&D evaluation feedback from 42 employees reveals a significant disconnect between the quality of the delivery and the impact of the learning. The analysis is grouped into three themes:
Theme 1: Facilitator and Delivery Quality (Very Strong Agreement)
- Pattern/Trend: There is very strong agreement (over 78% agreement) that the facilitator was knowledgeable, provided clear objectives, and used good quality resources. This is a significant strength for Technivara (SWOT Strength) and indicates that the delivery of the learning is high quality.
Theme 2: Pre-Learning Preparation and Alignment (Significant Uncertainty)
- Pattern/Trend: The statement “My learning preferences were consider prior the learning activity” had a high number of Not Sure responses (18 out of 42). Crucially, the statement “The learning linked to my performace target” had the highest number of Not Sure responses (24 out of 42), indicating that over half the employees do not see a clear connection between the training and their job role. This points to a fundamental flaw in the training needs analysis (TNA) process.
Theme 3: Learning Impact and Application (Very Strong Disagreement)
- Pattern/Trend: There is very strong disagreement on two critical outcome metrics:
- “I was able to engage with meaningful questioning and answering…” (76.19% disagreement).
- “At the end of the session the set learning outcomes were achieved” (78.57% disagreement).
- Diagnosis: This is the most critical finding. Despite a good facilitator, the majority of employees feel they did not achieve the outcomes or engage meaningfully. This suggests the learning was passive, or the outcomes were not relevant to the employees’ needs. The current L&D is likely a significant cost without a measurable return on investment (ROI), confirming the need for EBP to evaluate its effectiveness (AC 1.1, AC 3.1).
Recommendations
Based on the evidence from both data sets, the following recommendations are proposed to Sue Young to form the basis of her persuasive case for improving people practices:
| Priority | Recommendation | Justification (Evidence-Based) |
| 1 (Immediate) | Launch a Root Cause Analysis (RCA) in Quality Control and Casting. | 50% turnover and high vacancy rates in these critical operational areas pose an immediate risk to business continuity and product quality. The RCA is needed to diagnose the specific, non-obvious root causes (AC 1.2). |
| 2 (Short-Term) | Implement an Evidence-Based Recruitment Overhaul. | The significant lag in filling vacancies (e.g., Engineering, Audio Technical) is hindering the expansion. The paper-driven process must be replaced with a modern, data-driven Applicant Tracking System (ATS) and evidence-based selection methods to improve time-to-hire and quality of hire (AC 1.1, AC 3.1). |
| 3 (Strategic) | Redesign the L&D Strategy to Focus on TNA and Impact. | The current L&D is failing to deliver outcomes (78.57% disagreement on achieving outcomes). The strategy must shift from focusing on delivery (Theme 1) to alignment and impact (Themes 2 & 3). This requires a robust Training Needs Analysis (TNA) to ensure all learning is explicitly linked to performance targets (AC 3.2). |
| 4 (Foundational) | Introduce a People Practice Scorecard. | To overcome the “archaic” approach, a People Practice Scorecard must be implemented to track key financial (e.g., ROI of new ATS) and non-financial (e.g., eNPS, turnover % in high-risk departments) metrics. This provides the Board with the evidence needed for objective, rational decision-making (AC 3.2, AC 1.3). |
These recommendations provide a clear, evidence-based roadmap for Sue Young to transform Technivara’s people practices from a reactive, paper-driven function into a strategic, value-adding partner that can successfully support the company’s ambitious expansion goals.
| Department | Total Employees | Leavers | Leavers % | Vacancies | Vacancies % | Positions Filled | Positions Filled % | |
| Audio technical Department | 26 | 6 | 23.08% | 8 | 30.77% | 3 | 11.54% | |
| Offices and Administration | 15 | 4 | 26.67% | 5 | 33.33% | 5 | 33.33% | |
| Research and Development | 8 | 1 | 12.50% | 4 | 50.00% | 4 | 50.00% | |
| Quality control | 4 | 2 | 50.00% | 3 | 75.00% | 3 | 75.00% | |
| Dispatch | 15 | 4 | 26.67% | 6 | 40.00% | 6 | 40.00% | |
| Engineering | 35 | 8 | 22.86% | 8 | 22.86% | 3 | 8.57% | |
| Casting Department | 6 | 3 | 50.00% | 5 | 83.33% | 2 | 33.33% | |
| Sales & Marketing | 12 | 4 | 33.33% | 3 | 25.00% | 3 | 25.00% | |
| Human Resources | 4 | 1 | 25.00% | 1 | 25.00% | 1 | 25.00% | |
| Design | 12 | 3 | 25.00% | 5 | 41.67% | 2 | 16.67% | |
Beat Your Deadline
Hire a Writer Today!
✅ Get Your Assignment Done by Experts
References on CIPD 5CO02 Evidence-based Practice Assignment Example
Briner, R. B., Denyer, D., and Rousseau, D. M. (2009) ‘Evidence-based management: Concept cleanup, critique, and a call for collaboration’, Academy of Management Learning & Education, 8(1), pp. 19-32.
CIPD (2024) Evidence-based practice for effective decision-making. Available at: https://www.cipd.org/uk/knowledge/factsheets/evidence-based-practice-factsheet/ (Accessed: 23 October 2025).
ClearPoint Strategy (2025) Track 15 Key Non-Financial Performance Measures for Business Success. Available at: https://www.clearpointstrategy.com/blog/nonfinancial-performance-measures (Accessed: 23 October 2025).
Cottrell, S. (2017) Critical Thinking Skills: Effective Analysis, Argumentation and Reflection. 3rd edn. London: Palgrave.
Crane, A., and Matten, D. (2021) Business Ethics: Managing Corporate Citizenship and Sustainability in the Age of Globalization. 5th edn. Oxford: Oxford University Press.
Fitz-enz, J., and Davison, B. (2019) The New HR Analytics: Predicting the Economic Value of Your Talent Investment. New York: AMACOM.
Simon, H. A. (1972) ‘Theories of Bounded Rationality’, in McGuire, C. B. and Radner, R. (eds.) Decision and Organization. Amsterdam: North-Holland Publishing Company, pp. 161-176.
Leave a Reply