
Climate change represents one of the most pressing global challenges of the 21st century, manifesting through rising global temperatures, increasingly frequent and intense extreme weather events, and accelerating sea-level rise. These phenomena pose significant threats to ecosystems, economies, and human societies worldwide, necessitating robust strategies for both mitigation and adaptation. This Mapping Climate Change Impacts essay explores the critical role of Geographic Information Systems (GIS), particularly ArcGIS, in mapping climate change impacts, assessing vulnerabilities, and formulating targeted adaptation strategies. By integrating diverse datasets and providing powerful analytical and visualization capabilities, ArcGIS empowers decision-makers to gain deeper insights into complex environmental challenges and to plan for a more resilient future.
Contents
Mapping Climate Change Impacts : The Science and Evidence
The scientific consensus on climate change is unequivocal: the Earth’s climate is warming at an unprecedented rate, primarily due to anthropogenic emissions of greenhouse gases [1]. The Intergovernmental Panel on Climate Change (IPCC) provides comprehensive assessments of climate science, highlighting observed changes and projecting future impacts. Key indicators of this warming trend include rising global average temperatures, melting glaciers and ice sheets, and increasing ocean heat content.
Global Temperature Increase
Global average temperatures have risen significantly since the pre-industrial era. Data from NASA’s Goddard Institute for Space Studies (GISS) shows a clear upward trend in global annual mean temperature anomalies. As illustrated in Figure 1, the past few decades have seen a sharp acceleration in warming, with recent years being among the warmest on record. This warming is not uniform across the globe, with some regions experiencing more rapid temperature increases than others, leading to localized impacts such as prolonged heatwaves and altered agricultural seasons.
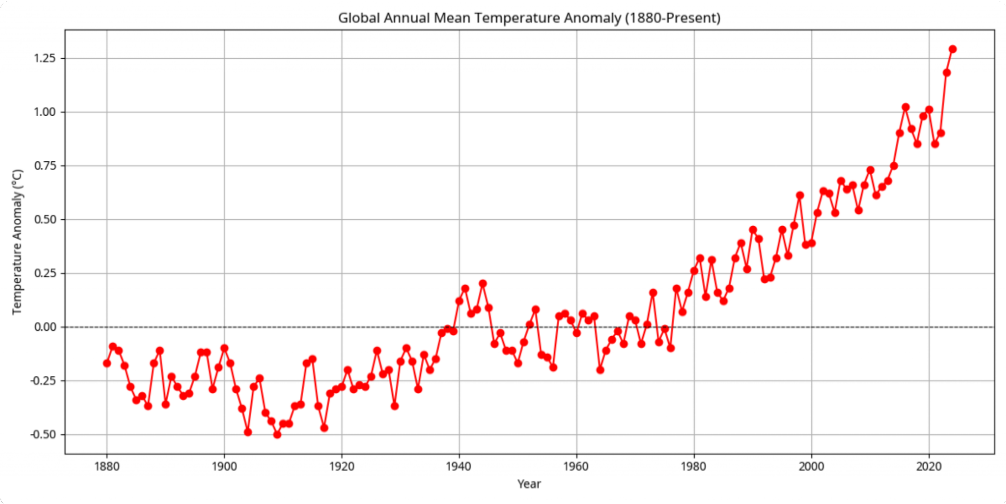
Figure 1: Global Annual Mean Temperature Anomaly (1880-Present). Data Source: NASA GISS [2].
Sea Level Rise
Another critical consequence of global warming is sea level rise, driven by thermal expansion of ocean water and the melting of glaciers and ice sheets. Satellite altimetry data, such as that provided by NOAA, demonstrates a consistent and accelerating rise in global mean sea level. Figure 2 depicts this trend, showing a steady increase in sea level over the past few decades. This phenomenon poses a direct threat to coastal communities, leading to increased coastal erosion, saltwater intrusion into freshwater sources, and heightened vulnerability to storm surges.
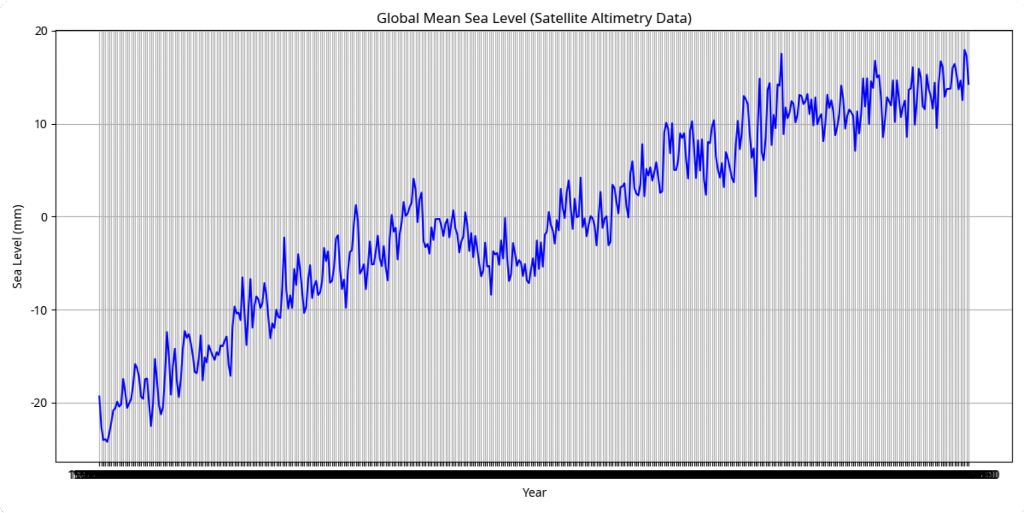
Figure 2: Global Mean Sea Level (Satellite Altimetry Data). Data Source: NOAA NESDIS STAR [3].
Extreme Weather Events
Climate change is also contributing to an increase in the frequency and intensity of extreme weather events. These include more severe heatwaves, prolonged droughts, heavier rainfall leading to flooding, and more powerful tropical cyclones. The economic and social costs associated with these events are substantial and growing. Data from NOAA’s National Centers for Environmental Information (NCEI) on billion-dollar weather and climate disasters in the U.S. provides a stark illustration of this trend. Figure 3 shows the total cost of these disasters by type, highlighting the significant financial burden imposed by events such as tropical cyclones and severe storms.
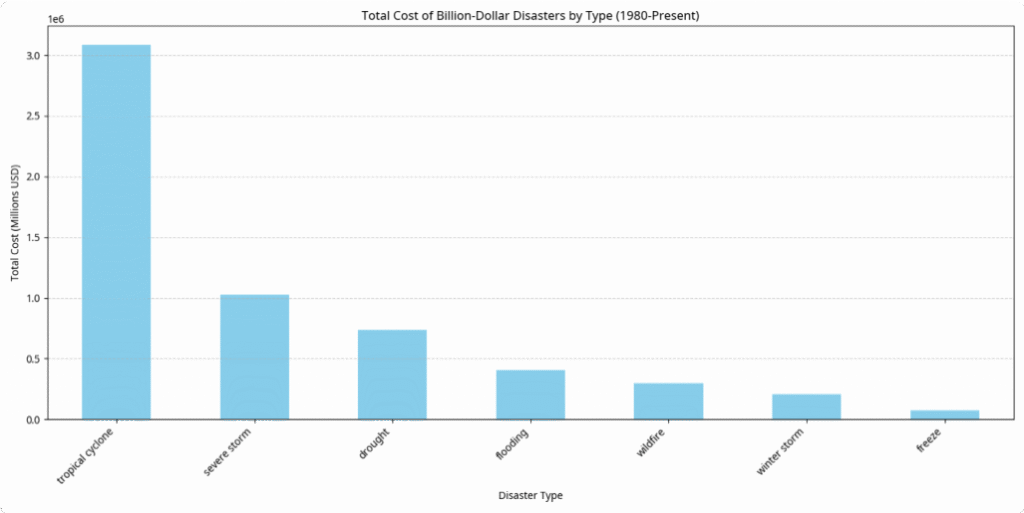
Figure 3: Total Cost of Billion-Dollar Disasters by Type (1980-Present). Data Source: NOAA NCEI [4].
Furthermore, the annual frequency and cost of these events have shown a clear upward trajectory, as seen in Figure 4. This escalation underscores the urgent need for effective adaptation and resilience-building measures.
Figure 4: Total Cost of Billion-Dollar Disasters by Year (1980-2023). Data Source: NOAA NCEI [4].
These observed impacts are consistent with climate model projections and reinforce the scientific understanding of human-induced climate change. The interconnectedness of these phenomena means that impacts in one area can exacerbate challenges in others, creating complex and cascading effects that demand integrated and data-driven solutions.
Beat Your Deadline
Hire a Writer Today!
✅ Get Your Assignment Done by Experts
Understanding Vulnerability and Risk Assessment
Vulnerability assessment in the context of climate change involves identifying populations, ecosystems, and infrastructure that are susceptible to the adverse effects of climate change, and understanding the factors that contribute to this susceptibility. Risk assessment, on the other hand, quantifies the potential losses from climate-related hazards, considering both the likelihood of an event and the severity of its impact. These assessments are fundamental to developing effective adaptation strategies, as they pinpoint where and how resources should be allocated to build resilience.
Key Components of Vulnerability
Vulnerability is often conceptualized as a function of exposure, sensitivity, and adaptive capacity [5].
- Exposure: Refers to the presence of people, livelihoods, species or ecosystems, environmental functions, services, and resources, infrastructure, or economic, social, or cultural assets in places and settings that could be adversely affected by climate hazards. For example, coastal communities are exposed to sea-level rise and storm surges, while agricultural regions are exposed to changes in precipitation patterns and increased temperatures.
- Sensitivity: Describes the degree to which a system or species is affected, either adversely or beneficially, by climate variability or change. A highly sensitive system might experience significant negative impacts from even minor climatic shifts. For instance, monoculture farming systems can be highly sensitive to changes in temperature or water availability, whereas diversified farming systems might be less so.
- Adaptive Capacity: Represents the ability of systems, institutions, humans, and other organisms to adjust to potential damage, to take advantage of opportunities, or to respond to consequences. High adaptive capacity implies a greater ability to cope with and recover from climate impacts. Factors influencing adaptive capacity include economic resources, technological capabilities, institutional strength, access to information, and social capital.
The Risk Assessment Framework
Climate change risk is typically defined as the product of hazard, exposure, and vulnerability [6].
- Hazard: The potential occurrence of a natural or human-induced physical event or trend that may cause loss of life, injury, or other health impacts, property damage, loss of livelihoods and services, social and economic disruption, or environmental damage. In the context of climate change, hazards include rising temperatures, altered precipitation, sea-level rise, and extreme weather events.
- Exposure: As defined above, the presence of elements at risk.
- Vulnerability: As defined above, the propensity or predisposition to be adversely affected.
By systematically analyzing these components, decision-makers can develop a comprehensive understanding of climate risks. For example, a risk assessment for a coastal city might involve mapping areas exposed to different levels of sea-level rise (hazard and exposure), identifying critical infrastructure and vulnerable populations within those areas (sensitivity), and evaluating the city’s capacity to implement protective measures (adaptive capacity).
Importance of Spatial Analysis
The inherently spatial nature of climate change impacts and vulnerabilities makes geospatial analysis an indispensable tool for these assessments. Climate hazards, exposure of assets, and the distribution of vulnerable populations all vary significantly across geographic space. Traditional, non-spatial analyses often fail to capture these critical spatial variations, leading to generalized conclusions that may not be effective at the local level. Geospatial technologies, such as GIS, enable the integration of diverse spatial data, allowing for detailed, localized assessments that inform targeted interventions.
ArcGIS: A Powerful Tool for Climate Change Analysis
Geographic Information Systems (GIS) have emerged as indispensable tools in the fight against climate change, offering powerful capabilities for data integration, spatial analysis, and visualization. Among GIS platforms, ArcGIS stands out as a comprehensive and widely adopted solution, enabling researchers, policymakers, and practitioners to understand, model, and respond to climate change impacts at various scales. Its robust suite of tools facilitates everything from detailed mapping of environmental changes to complex vulnerability assessments and the strategic planning of adaptation measures.
Data Integration and Management
One of ArcGIS’s primary strengths lies in its ability to integrate and manage diverse geospatial datasets. Climate change analysis often requires combining information from various sources, including:
- Climate Data: Historical temperature and precipitation records, future climate projections (e.g., from downscaled global climate models), and extreme weather event data.
- Environmental Data: Topography, land cover, soil types, hydrological networks, and ecological zones.
- Socio-economic Data: Population density, demographic information, income levels, infrastructure locations (e.g., roads, buildings, utilities), and critical facilities (e.g., hospitals, schools).
- Hazard Data: Floodplain maps, sea-level rise inundation models, wildfire risk zones, and drought severity indices.
ArcGIS provides the framework to organize these disparate datasets into a unified geographic database, allowing for seamless overlay and analysis. This integration is crucial for building a holistic picture of climate change impacts and vulnerabilities.
Spatial Analysis Capabilities
ArcGIS offers a rich array of spatial analysis tools that are directly applicable to climate change studies:
- Overlay Analysis: Combining multiple layers of information (e.g., flood zones with population density) to identify areas of high vulnerability or risk. For instance, overlaying projected sea-level rise maps with urban infrastructure layers can pinpoint critical assets at risk of inundation.
- Proximity Analysis: Measuring distances and identifying areas within a certain range of a feature. This can be used to assess populations living near vulnerable coastlines or critical ecosystems.
- Suitability Modeling: Identifying areas that meet specific criteria for certain activities or conditions. In adaptation planning, this can help locate suitable sites for new infrastructure, reforestation efforts, or managed retreat strategies.
- Network Analysis: Analyzing connectivity and flow within networks, such as transportation routes or utility grids. This is vital for understanding potential disruptions from extreme weather events and planning resilient infrastructure.
- Raster Analysis: Working with grid-based data, such as satellite imagery or climate model outputs. Tools like map algebra allow for complex calculations and modeling of environmental processes, such as changes in vegetation health or water availability.
Beat Your Deadline
Hire a Writer Today!
✅ Get Your Assignment Done by Experts
Visualization and Communication
Beyond analysis, ArcGIS excels in visualizing complex spatial information through maps, 3D scenes, and web applications. Effective visualization is paramount for communicating climate change risks and adaptation strategies to a wide range of stakeholders, from local communities to national policymakers. Interactive web maps and dashboards, built using ArcGIS Online or ArcGIS Enterprise, allow users to explore data, run simple scenarios, and understand the spatial dimensions of climate impacts. This enhances public engagement and supports collaborative decision-making.
Modeling and Scenario Planning
ArcGIS can be used to develop and run various climate change models and scenarios. For example:
- Sea-Level Rise Inundation Modeling: Simulating different sea-level rise scenarios to visualize future coastal flooding and identify affected areas.
- Storm Surge Modeling: Integrating meteorological data with topographic and bathymetric data to predict the extent and depth of storm surge inundation.
- Habitat Suitability Modeling: Projecting how species distributions might shift under different climate scenarios, informing conservation efforts.
- Agricultural Yield Modeling: Assessing the potential impacts of changing temperatures and precipitation on crop yields, guiding agricultural adaptation.
By enabling such detailed modeling, ArcGIS provides a powerful platform for understanding potential future conditions and testing the effectiveness of different adaptation interventions before implementation.
Case Studies: ArcGIS in Action
The theoretical capabilities of ArcGIS in climate change analysis are best understood through practical applications. Numerous organizations and governments worldwide have leveraged ArcGIS to map impacts, assess vulnerabilities, and plan for adaptation. These case studies demonstrate the versatility and effectiveness of geospatial technology in addressing real-world climate challenges.
Case Study 1: Coastal Vulnerability Assessment in Florida, USA
Florida, with its extensive coastline and low-lying topography, is highly susceptible to sea- level rise and increased hurricane intensity. Local governments and planning agencies in Florida have extensively used ArcGIS to conduct detailed coastal vulnerability assessments. For instance, the Florida Department of Environmental Protection (FDEP) and various regional planning councils utilize ArcGIS to:
- Map Inundation Scenarios: By integrating high-resolution elevation data (Lidar) with projected sea-level rise scenarios (e.g., 1-foot, 3-foot, 6-foot rise), they create detailed inundation maps. These maps visually represent areas that would be permanently submerged or experience increased tidal flooding [7].
- Identify Critical Infrastructure at Risk: Overlaying these inundation maps with layers of critical infrastructure (e.g., wastewater treatment plants, power substations, transportation networks, emergency services) allows planners to identify which assets are most vulnerable. This informs decisions on hardening infrastructure, relocating facilities, or implementing protective measures like seawalls and living shorelines.
- Assess Socio-Economic Vulnerability: Demographic data, including population density, age distribution, income levels, and access to transportation, are integrated to identify socially vulnerable populations (e.g., elderly, low-income, or car-less residents) who may have limited capacity to respond to or recover from climate impacts. This helps prioritize equitable adaptation strategies and evacuation planning.
Example: In Miami-Dade County, ArcGIS has been instrumental in visualizing the impacts of saltwater intrusion on freshwater supplies and planning for the relocation of wellfields further inland. It also supports the county’s ‘Resilient305’ strategy, which includes developing green infrastructure solutions and elevating roads in vulnerable areas [8].
Case Study 2: Drought Monitoring and Agricultural Adaptation in California, USA
California frequently experiences severe droughts, which have profound impacts on its agricultural sector, water resources, and wildfire risk. ArcGIS plays a crucial role in monitoring drought conditions, assessing agricultural vulnerability, and guiding water management and adaptation strategies.
- Drought Severity Mapping: Agencies like the California Department of Water Resources (DWR) use ArcGIS to integrate various drought indicators, including precipitation deficits, snowpack levels, reservoir storage, and soil moisture data, to create real-time drought severity maps. These maps often incorporate data from remote sensing platforms (e.g., NASA’s GRACE mission for groundwater levels) and ground- based sensors [9].
- Agricultural Impact Assessment: By overlaying drought severity maps with agricultural land use data, crop types, and irrigation infrastructure, analysts can assess which crops and regions are most at risk. This helps in estimating potential crop losses and identifying farmers who may require assistance.
- Water Resource Management: ArcGIS is used to model water supply and demand, optimize reservoir operations, and identify areas where water conservation measures are most critical. It also supports the mapping of groundwater basins and monitoring of groundwater depletion, which is a significant issue during droughts.
Example: The California Water Atlas, built on ArcGIS Online, provides a public platform for visualizing water data, including drought conditions, water rights, and infrastructure. This transparency aids in public understanding and collaborative decision-making for water management [10].
Case Study 3: Urban Heat Island Mitigation in Phoenix, Arizona, USA
Phoenix, a rapidly growing desert city, faces significant challenges from the urban heat island (UHI) effect, exacerbated by rising global temperatures. The city has utilized ArcGIS to map and mitigate UHI impacts.
- Thermal Mapping: High-resolution thermal imagery from satellites (e.g., Landsat) is processed in ArcGIS to create detailed maps of land surface temperatures across the city. These maps identify areas with the most intense heat, often corresponding to dense urban development with limited green space [11].
- Vulnerability Analysis: Overlaying thermal maps with demographic data (e.g., elderly populations, outdoor workers, low-income communities) helps identify populations most vulnerable to heat-related illnesses. Access to cooling centers and healthcare facilities is also mapped to assess adaptive capacity.
- Green Infrastructure Planning: ArcGIS is used to identify optimal locations for planting trees, creating green spaces, and implementing cool pavement technologies. Spatial analysis helps determine where these interventions will have the greatest impact on reducing ambient temperatures and improving public health outcomes, considering factors like shade coverage, evapotranspiration, and proximity to vulnerable populations.
Example: The Phoenix HeatReady program uses GIS to inform its strategies for heat mitigation, including community outreach and the development of a comprehensive tree and shade master plan. The spatial insights gained from ArcGIS help in prioritizing neighborhoods for tree planting initiatives [12].
These case studies underscore ArcGIS’s pivotal role in transforming complex climate data into actionable insights, enabling more informed and effective climate action at local, regional, and national levels.
Developing Adaptation Strategies with Geospatial Insights
Climate change adaptation involves adjusting to actual or expected future climate. The goal is to reduce vulnerability to the harmful effects of climate change (like sea-level rise, extreme heat, or food insecurity) and to take advantage of any new opportunities that may arise. Geospatial insights, particularly those derived from ArcGIS, are fundamental to designing, implementing, and monitoring effective adaptation strategies because they provide the necessary spatial context for decision-making.
Types of Adaptation Strategies
Adaptation strategies can be broadly categorized into several types, each benefiting significantly from geospatial analysis:
- Infrastructure-based Adaptation (Grey Infrastructure): This involves constructing physical structures to protect against climate impacts. Examples include seawalls, dikes, storm surge barriers, and improved drainage systems. ArcGIS is crucial for siting these structures, analyzing their protective reach, and assessing their impact on surrounding areas. For instance, hydraulic modeling in ArcGIS can simulate flood depths with and without proposed levees, informing optimal design and placement.
- Nature-based Solutions (Green Infrastructure): These strategies leverage natural ecosystems to provide climate resilience benefits. Examples include restoring wetlands for flood protection, planting urban forests to mitigate heat islands, and conserving mangroves to protect coastlines. ArcGIS helps identify suitable locations for these interventions, map ecosystem services, and monitor their effectiveness over time. It can also be used to assess the co-benefits of green infrastructure, such as improved air quality or biodiversity.
- Policy and Planning Adaptation: This involves changes in regulations, land-use planning, and zoning to reduce exposure and vulnerability. Examples include setback regulations for coastal development, revised building codes for extreme weather, and managed retreat strategies. ArcGIS is essential for developing future land-use scenarios, identifying areas suitable for specific types of development, and visualizing the implications of different policy choices on spatial patterns of risk.
- Technological Adaptation: This includes the adoption of new technologies to cope with climate change, such as drought-resistant crops, early warning systems for extreme weather, and efficient irrigation technologies. Geospatial data can inform the optimal deployment of these technologies, for example, by mapping areas where drought- resistant crops are most needed or where early warning systems can protect the most people.
- Community-based Adaptation: These are locally driven strategies that empower communities to identify their vulnerabilities and implement solutions tailored to their specific contexts. ArcGIS can facilitate participatory mapping processes, allowing local knowledge to be integrated with scientific data, and enabling communities to visualize their risks and plan collective actions.
The Role of ArcGIS in Adaptation Planning Lifecycle
ArcGIS supports the entire adaptation planning lifecycle, from initial assessment to implementation and monitoring:
- Risk and Vulnerability Assessment: As discussed, ArcGIS is central to identifying and mapping hazards, exposure, and vulnerabilities. This foundational step provides the evidence base for adaptation.
- Option Identification and Prioritization: Once risks are understood, ArcGIS can be used to identify and evaluate potential adaptation options. Multi-criteria analysis tools within ArcGIS can help prioritize strategies based on factors like cost-effectiveness, feasibility, social equity, and environmental benefits. For example, a city might use ArcGIS to compare the benefits of a seawall versus a restored wetland for coastal protection, considering ecological impacts and community access.
- Scenario Planning and Modeling: ArcGIS allows planners to model the effectiveness of different adaptation strategies under various future climate scenarios. This helps in understanding potential outcomes and making robust decisions that are effective across a range of possibilities. For instance, simulating the impact of a 100-year flood event with and without a proposed drainage improvement project can demonstrate its efficacy.
- Implementation and Monitoring: During implementation, ArcGIS can be used for project management, tracking progress, and ensuring that adaptation measures are being deployed in the intended locations. Post-implementation, geospatial data and remote sensing can be used to monitor the effectiveness of strategies, such as tracking changes in vegetation cover for green infrastructure projects or monitoring coastal erosion rates after beach nourishment.
- Communication and Stakeholder Engagement: Interactive web maps and dashboards created with ArcGIS are powerful tools for communicating adaptation plans to stakeholders, soliciting feedback, and fostering public support. Visualizing the problem and proposed solutions in a spatial context makes complex information accessible and relatable.
Example: Flood Resilience Planning in Rotterdam, Netherlands
Rotterdam, a city largely below sea level, is a global leader in flood resilience. The city utilizes advanced geospatial tools, including ArcGIS, to manage its complex water systems and plan for future climate impacts. Their approach involves:
- Integrated Water Management: ArcGIS is used to map and manage all aspects of the urban water cycle, including rivers, canals, drainage systems, and green roofs. This integrated view allows for holistic planning that considers both traditional flood defenses and innovative water storage solutions.
- “Room for the River” Project: This large-scale initiative involved widening rivers, creating floodplains, and constructing bypasses to increase the capacity of the river system. ArcGIS was critical in designing these interventions, analyzing their hydrological impacts, and managing the complex land acquisition and construction processes [13].
- Climate-Proofing Urban Areas: The city uses ArcGIS to identify areas vulnerable to extreme rainfall and heat. This informs the development of climate-adaptive urban designs, such as water plazas that temporarily store excess rainwater and green spaces that reduce urban heat. Geospatial analysis helps optimize the placement and design of these features for maximum benefit [14].
By systematically integrating geospatial insights into every stage of adaptation planning, cities like Rotterdam are building more resilient futures in the face of escalating climate change impacts.
Conclusion
Climate change presents an unprecedented challenge, demanding innovative and integrated approaches to understand its impacts, assess vulnerabilities, and develop effective adaptation strategies. Geographic Information Systems, with ArcGIS at the forefront, have proven to be indispensable tools in this endeavor. By facilitating the integration of diverse datasets, enabling sophisticated spatial analysis, and providing powerful visualization capabilities, ArcGIS empowers decision-makers to move beyond generalized assessments to highly localized and actionable insights.
The ability of ArcGIS to map climate hazards, identify exposed assets and vulnerable populations, and model the effectiveness of various adaptation interventions is transforming how communities and governments respond to a changing climate. From coastal protection and drought management to urban heat island mitigation, the case studies presented demonstrate the tangible benefits of applying geospatial intelligence to real-world climate challenges. These applications underscore the critical importance of data-driven decision-making and the power of spatial understanding in building resilience.
As climate change impacts continue to intensify, the role of advanced geospatial technologies like ArcGIS will only grow. Continued investment in data collection, analytical tools, and skilled professionals capable of leveraging these platforms will be paramount.
Ultimately, by harnessing the power of spatial data and analysis, we can foster more resilient communities, protect vital ecosystems, and navigate the complexities of a warming world with greater foresight and effectiveness. The journey towards a climate-resilient future is inherently spatial, and ArcGIS provides a vital compass for this critical path.
Beat Your Deadline
Hire a Writer Today!
✅ Get Your Assignment Done by Experts
References
[1]IPCC, 2023: Climate Change 2023: Synthesis Report. Contribution of Working Groups I, II and III to the Sixth Assessment Report of the Intergovernmental Panel on Climate Change [Core Writing Team, H. Lee and J. Romero (eds.)]. IPCC, Geneva, Switzerland. URL: https://www.ipcc.ch/report/ar6/syr/
[2]GISS Surface Temperature Analysis (GISTEMP), v4. NASA Goddard Institute for Space Studies. URL: https://data.giss.nasa.gov/gistemp/
[3]NOAA Laboratory for Satellite Altimetry. Global Mean Sea Level Time Series. URL: https://www.star.nesdis.noaa.gov/socd/lsa/SeaLevelRise/LSA_SLR_timeseries_global.php
[4]NOAA National Centers for Environmental Information (NCEI). U.S. Billion-Dollar Weather and Climate Disasters. URL: https://www.ncei.noaa.gov/access/billions/
[5]IPCC, 2014: Climate Change 2014: Impacts, Adaptation, and Vulnerability. Part A: Global and Sectoral Aspects. Contribution of Working Group II to the Fifth Assessment Report of the Intergovernmental Panel on Climate Change [Field, C.B. et al. (eds.)]. Cambridge University Press, Cambridge, United Kingdom and New York, NY, USA, pp. 5‒10. URL: https://www.ipcc.ch/report/ar5/wg2/
[6]UNISDR, 2017: Sendai Framework for Disaster Risk Reduction 2015-2030. United Nations Office for Disaster Risk Reduction. URL: https://www.undrr.org/publication/sendai-framework-disaster-risk-reduction-2015-2030
[7]Florida Department of Environmental Protection. Coastal and Aquatic Managed Areas (CAMA) Program. URL: https://floridadep.gov/cmp/coastal-resilience
[8]Miami-Dade County. Resilient305. URL: https://www.miamidade.gov/global/initiatives/resilience/resilient305.page
[9]California Department of Water Resources. Drought Information. URL: https://water.ca.gov/Programs/Drought-Management
[10]California Water Atlas. URL: https://wateratlas.org/
[11]City of Phoenix. HeatReady Program. URL: https://www.phoenix.gov/oep/heat
[12]City of Phoenix. Tree and Shade Master Plan. URL: https://www.phoenix.gov/parks/tree- and-shade-master-plan
[13]Room for the River Programme. URL: https://www.roomfortheriver.com/
[14]City of Rotterdam. Rotterdam Climate Adaptation Strategy. URL: https://www.rotterdam.nl/english/climate-change/
Leave a Reply