In the article
Identifying Disparities with ArcGIS for Social Justice Initiatives
Introduction
This Geospatial Analysis of Social Inequality essay will explore the profound utility of geospatial analysis, particularly through ArcGIS, in illuminating social inequality. We will examine dimensions of inequality, principles of geospatial analysis, and ArcGIS functionalities. Through case studies in health, education, and environmental justice, we will demonstrate how this technology provides critical insights for addressing systemic inequities.
Finally, we will discuss challenges, ethical considerations, and the promising future of geospatial analysis in fostering a more equitable world.
Social inequality, a pervasive challenge, profoundly impacts human experience globally. It manifests as wealth disparities and as unequal access to essential resources, opportunities, and fundamental rights.
Understanding these intricate disparities is crucial for effective interventions and fostering a just society.
Understanding these intricate disparities is crucial for effective interventions and fostering a just society.
From healthcare and education to environmental quality, systemic barriers perpetuate disadvantage for certain groups.
Understanding these intricate disparities is crucial for effective interventions and fostering a just society. Geospatial analysis is an indispensable tool in this pursuit. By integrating geographic information with socioeconomic, demographic, and environmental data, it offers a unique lens to visualize, quantify, and understand the spatial dimensions of inequality.
This approach reveals localized patterns of disparity, highlighting areas and populations most affected. This spatial perspective is critical because many forms of social inequality are inherently tied to place.
Where people live, work, and access services profoundly impacts their life chances.
ArcGIS, a leading Geographic Information System (GIS) platform by Esri, is at the forefront of this analytical revolution. Its robust capabilities for data integration, visualisation, and spatial analysis make it invaluable for researchers and social justice advocates.
ArcGIS transforms raw data into actionable insights, facilitating collaborative efforts towards positive change.
Understanding Social Inequality
Social inequality is a complex phenomenon marked by the unequal distribution of resources, opportunities, and privileges within society [1]. It extends beyond economic disparities, encompassing dimensions like race, gender, age, origin, ethnicity, disability, and sexual orientation. These intersecting identities often compound disadvantages, creating layers of marginalization [2].
2.1. Defining Social Inequality: Beyond Income
Social inequality signifies unequal access to societal benefits and rights [1]. This is evident in critical sectors:
- Education: Disparities in funding, teacher quality, and resources lead to unequal academic outcomes [3]. Schools in low-income areas often receive less funding, perpetuating disadvantage [4].
- Healthcare: Unequal access to quality services, insurance, and preventative care results in significant health disparities. Minorities and low-income populations often face higher rates of chronic diseases and lower life expectancies [5].
- Housing: Segregation and discriminatory practices limit access to safe, affordable housing, leading to concentrated poverty and reduced access to essential services [6].
- Transportation: Inadequate public transport restricts access to employment, education, and healthcare, disproportionately affecting low-income and rural communities [7].
- Green Spaces: Unequal distribution of parks impacts public health, with disadvantaged neighborhoods often having less access [8].
These dimensions are interconnected, forming a reinforcing cycle of advantage and disadvantage. For example, limited education can lead to lower-paying jobs, affecting housing and healthcare access.
2.2. Manifestations of Inequality: Systemic Barriers and Unequal Distribution
Social inequality stems from systemic barriers and entrenched societal structures, not just individual choices. Consequences include:
- Unequal Opportunities: Hurdles in accessing quality education, employment, and upward mobility.
- Disparities in Outcomes: Differences in health, education, income, and exposure to environmental hazards.
- Social Exclusion: Marginalization from mainstream social, economic, and political life.
2.3. The Spatial Dimension of Inequality: Why Location Matters
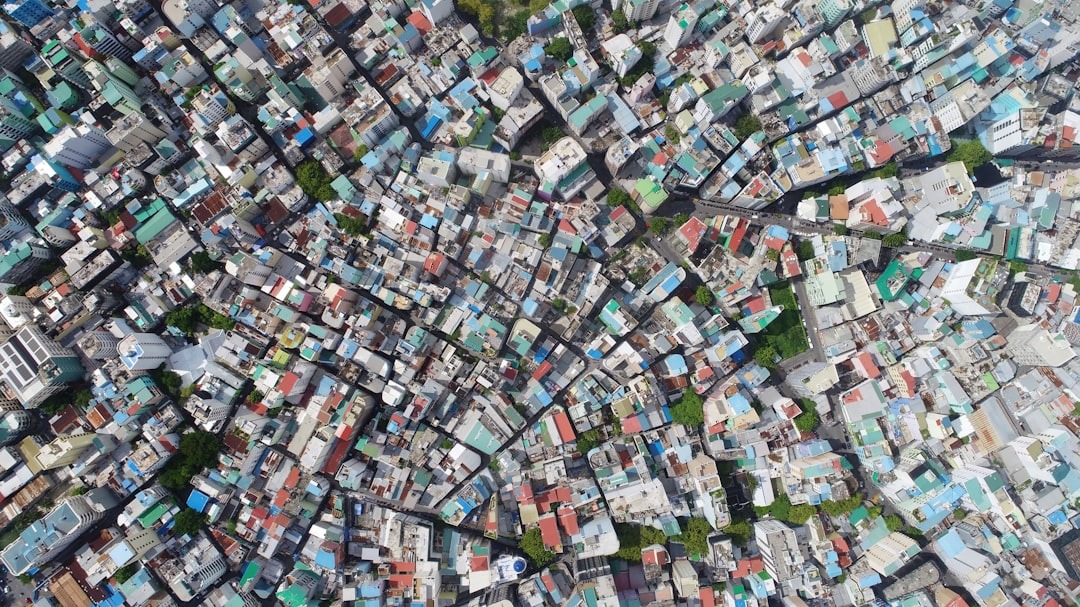
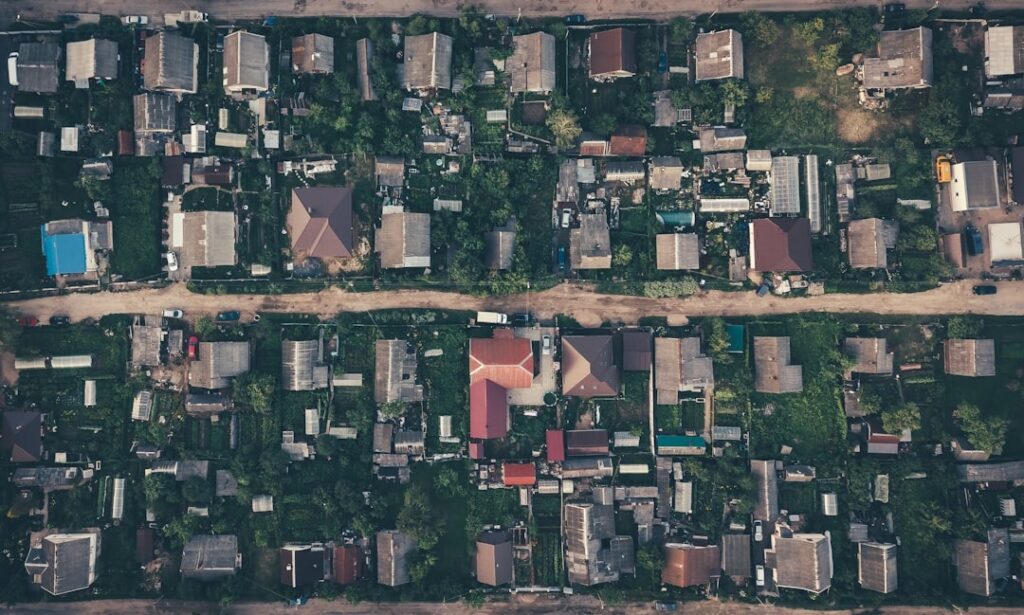
Location critically influences access to resources and exposure to risks. Neighborhoods often show distinct patterns of resource distribution and vulnerability. Areas with high poverty may lack healthy food, quality schools, and safe recreation. Conversely, affluent areas boast superior infrastructure and services.
Geographic location determines access to:
- Essential Services: Proximity to hospitals, schools, and public transport.
- Economic Opportunities: Access to job markets.
- Environmental Quality: Exposure to pollution and green spaces.
- Social Capital: Community resources fostering well-being.
Understanding these spatial patterns is fundamental for effective intervention. It identifies areas needing support and tailors solutions to unique community challenges. Geospatial analysis, by mapping and analyzing data geographically, is indispensable for social justice.
Fundamentals of Geospatial Analysis
Geospatial analysis examines phenomena related to their geographic location. It involves collecting, storing, manipulating, analyzing, managing, and presenting geographically referenced data [9]. Unlike traditional data analysis, geospatial analysis integrates the crucial element of ‘where,’ revealing spatial patterns, relationships, and trends. This is vital for understanding social inequality, as disparities are often linked to specific locations.
3.1.What is Geospatial Analysis? (Definition, Data Types, Tools)
Geospatial analysis applies analytical techniques to data with a geographic component. Geospatial data is information tied to specific Earth locations, including:
- Vector Data: Represents discrete features (points, lines, polygons) with associated attributes (e.g., population, road type).
- Raster Data: Represents continuous phenomena (e.g., satellite imagery, elevation) using a grid of cells.
- Attribute Data: Non-spatial information linked to geographic features (e.g., demographic statistics, income levels).
The primary tool is a Geographic Information System (GIS). A GIS is a framework for gathering, managing, and analyzing data. It integrates various data types, analyzes spatial location, and organizes information into maps and 3D scenes, revealing insights for smarter decisions [10].
3.2.Key Concepts: Spatial Data, GIS, Mapping, Spatial Statistics
Key concepts in geospatial analysis include:
- Spatial Data: Data directly or indirectly referring to a geographic location. Accuracy and resolution are paramount.
- Geographic Information System (GIS): A comprehensive system (hardware, software, data, people, methods) for spatial analysis, querying, and presentation [10].
- Mapping: A fundamental output and analytical process. Thematic, choropleth, and heat maps visualize spatial patterns and concentrations, communicating complex relationships effectively.
- Spatial Statistics: Deals with spatially dependent data, accounting for spatial autocorrelation and heterogeneity. Techniques include:
- Cluster Analysis: Identifying statistically significant hot spots or cold spots of a phenomenon [12].
- Spatial Regression: Modeling relationships between variables while accounting for spatial dependence for accurate predictions.
- Accessibility Analysis: Measuring ease of reaching services based on travel time or distance [13].
- Density Mapping: Visualizing concentration of features over an area.
3.3.Evolution of Geospatial Technology: From Maps to Advanced Analytics
Geospatial technology has evolved from static maps to dynamic GIS. Driven by improvements in satellite imagery, GPS, remote sensing, and computational power, it now handles big data, complex spatial modeling, and integrates with AI and ML. This transformation makes it indispensable for tackling complex societal challenges like social inequality, enabling nuanced analyses.
ArcGIS as a Tool for Social Justice
ArcGIS, Esri’s comprehensive GIS platform, offers powerful tools for spatial analysis, mapping, and data management. Its capabilities extend beyond traditional cartography, making it indispensable for addressing social justice issues. By integrating, analyzing, and visualizing diverse datasets geographically, ArcGIS empowers stakeholders to gain insights into inequality and inform targeted interventions.
4.1.Overview of ArcGIS Capabilities: Data Integration, Visualization, Analysis
ArcGIS facilitates understanding social inequality through:
- Data Integration: Integrates disparate data sources like demographics, health statistics, environmental data, and socioeconomic indicators. This reveals complex interdependencies; e.g., overlaying income with food access can show food deserts in low-income areas.
- Visualization: Transforms raw data into compelling visual representations using thematic, heat, and choropleth maps. These communicate spatial distribution and intensity of disparities, crucial for raising awareness and engaging diverse audiences. A well-designed map makes abstract statistics tangible.
- Analysis: Its robust analytical engine quantifies disparities, identifies causes, and models intervention impacts. These tools enable rigorous scientific inquiry into spatial dimensions of social problems, uncovering statistically significant patterns.
4.2.Specific ArcGIS Tools for Social Equity Analysis
ArcGIS offers specialized tools for social equity analysis:
- 4.2.1. Mapping and Visualization: Identifying Patterns and Hot Spots ArcGIS creates detailed maps, symbolizing data by attributes (income, health, demographics) to highlight areas of need. Heat maps show concentrations of issues (crime, disease), while choropleth maps illustrate socioeconomic indicator distribution. Layering datasets reveals correlations, like low income and poor health outcomes [11].
- 4.2.2. Spatial Statistics: Measuring Segregation, Accessibility, and Disparities ArcGIS’s spatial statistics tools enable quantitative analysis and validation of observations:
- Cluster and Outlier Analysis (Anselin Local Moran’s I, Getis-Ord Gi):* Identifies statistically significant spatial clusters (hot spots/cold spots) and outliers, e.g., neighborhoods with high unemployment or low food access [12].
- Accessibility Analysis (Network Analyst): Measures access to services based on network distance/travel time, determining how many people can reach healthcare within a given time, crucial for understanding service disparities [13].
- Buffer Analysis: Creates zones around features (schools, parks, industrial sites) to identify populations within proximity, assessing exposure to hazards or access to green spaces [8].
- Density Mapping: Calculates concentration of point features (crimes, disease cases) to highlight high-density areas of social issues.
- Spatial Regression: Models relationships between variables, accounting for spatial autocorrelation, to identify inequality drivers and predict disparities.
- 4.2.3. Geocoding and Data Enrichment: Linking Disparate Datasets to Location Geocoding converts addresses to geographic coordinates for mapping and analysis. ArcGIS also enriches data by appending demographic and socioeconomic attributes to geographic features, enhancing analytical potential.
- 4.2.4. StoryMaps and Dashboards: Communicating Findings Effectively ArcGIS StoryMaps and Dashboards communicate complex geospatial analyses.
StoryMaps combine maps with narrative, images, and multimedia for engaging presentations. Dashboards provide dynamic visualizations of key indicators, allowing real-time data exploration. These tools translate insights into actionable information for policymakers and the public, fostering transparency [14].
Beat Your Deadline
Hire a Writer Today!
✅ Get Your Assignment Done by Experts
Case Studies: Applying Geospatial Analysis to Social Inequality
These case studies illustrate how geospatial analysis, particularly with ArcGIS, identifies disparities, understands their causes, and informs targeted social justice interventions.
Case Study 1: Health Disparities and Access to Healthcare
Health disparities, preventable differences in health burdens experienced by disadvantaged populations, are a critical manifestation of social inequality [15]. Unequal access to quality healthcare, often along socioeconomic and racial lines, is a fundamental issue. Geospatial analysis helps uncover these disparities and guides health equity efforts.
5.1.1.Example: Mapping Healthcare Facility Access in Underserved Communities
A public health agency aims to address healthcare access in a metropolitan area. Geospatial analysis with ArcGIS provides a clear picture. By mapping existing primary healthcare facilities and overlaying demographic data (population density, income, race, age) from the
U.S. Census Bureau, patterns of access and disparity emerge [16].
5.1.2.Data Sources and ArcGIS Application
Analysis integrates:
- Healthcare Facility Locations: Geocoded addresses of providers.
- Demographic Data: Census tracts with population, age, race, income, and insurance data [17].
- Road Network Data: For calculating travel times. ArcGIS analytical techniques:
- Service Area Analysis: Creates service areas (e.g., 10-minute drive times) around facilities to identify areas outside reasonable access [13].
- Accessibility Mapping: Quantifies people (or specific groups) within a travel time/distance of facilities, revealing effective inaccessibility.
- Hot Spot Analysis (Getis-Ord Gi):* Identifies clusters of high health disparities and poor access, pinpointing critical intervention areas [12].
- Overlay Analysis: Identifies areas where multiple disadvantages (poverty, race, poor access) converge.
5.1.3.Impact on Social Justice Initiatives
Geospatial insights are invaluable for health equity:
- Targeted Resource Allocation: Maps show where new clinics or mobile units are most needed.
- Informing Policy Decisions: Provides evidence for policies improving public transportation to healthcare, incentivizing providers in underserved areas, or expanding telehealth.
- Community Engagement and Advocacy: Visual maps empower organizers to advocate for change and mobilize residents.
- Monitoring and Evaluation: Tracks intervention impact on access and health outcomes.
ArcGIS facilitates understanding social inequality through data integration, visualisation, and analysis.
For example, analysis might show low-income, minority neighborhoods have longer travel times to clinics. This spatial evidence supports advocating for new community health centers or improved public transit, linking analysis to actionable social justice outcomes.
ArcGIS facilitates understanding social inequality through data integration, visualisation, and analysis.
- 3CO04 Essentials of People Practice Example- Comprehensive Assessment Response
- CIPD 3CO03 Assignment Example: Core Behaviours for People Professionals – Assignment Responses
- Guide to Kotter’s 8 Step Model and Comparative Frameworks
- The Evolution of Language in the Age of AI: Analyzing the Impact of Large Language Models on Creative Writing
- Statistics Project Ideas: 50 Plus Topics for 2026
Case Study 2: Educational Inequality and Resource Allocation
Educational inequality impacts social mobility and perpetuates poverty. Disparities in outcomes often link to unequal resource allocation. Geospatial analysis exposes these inequities and advocates for equitable opportunities.
5.2.1.Example: Analyzing School District Funding vs. Student Outcomes
An education advocacy group wants to show how funding disparities affect student outcomes. They suspect low-income or minority-serving districts receive less funding, leading to poorer academic performance. Geospatial analysis provides empirical evidence for policy change.
5.2.2.Data Sources and ArcGIS Application
Analysis integrates:
- School District Boundaries: Geographic boundaries from state education departments.
- School Performance Data: Academic metrics (test scores, graduation rates) by school/district [18].
- Socioeconomic Indicators: Student demographics (free/reduced-price lunch, race/ethnicity) and community SES (income, poverty) from Census Bureau and state education departments [19].
- Funding Data: Per-pupil expenditure data from state education finance reports [20]. ArcGIS analysis:
- Overlay Analysis: Reveals correlations between socioeconomic data and funding. Districts with more low-income students might show lower per-pupil spending.
- Choropleth Mapping: Maps per-pupil spending and academic outcomes by district, highlighting disparities and suggesting links between funding and performance.
- Spatial Regression: Statistically determines the relationship between funding, SES, and outcomes, accounting for spatial dependence [21].
- Accessibility to Resources: Maps spatial distribution of educational resources (libraries, after-school programs) and their accessibility to student populations.
5.2.3. Impact on Social Justice Initiatives
Geospatial analysis findings are crucial for educational equity:
- Evidence-Based Advocacy: Maps and statistics provide compelling evidence for equitable school finance policies. Showing minority-serving districts receive less funding strengthens reform arguments [4].
- Targeted Interventions: Identifies schools/districts where funding shortfalls impact performance, allowing for targeted aid or specialized programs.
- Informing Policy and Litigation: Geospatial evidence supports legal challenges against inequitable funding systems.
- Community Empowerment: Map-based evidence empowers communities to demand resources and hold policymakers accountable.
For example, analysis might show lower per-pupil spending and graduation rates in districts with high concentrations of Black and Hispanic students. This insight pushes for equity- prioritizing state funding formulas.
Case Study 3: Environmental Justice and Pollution Exposure
Environmental justice ensures fair treatment and meaningful involvement for all people regarding environmental laws and policies [22]. Low-income communities and communities of color often bear a disproportionate burden of pollution. Geospatial analysis identifies these injustices and empowers affected communities.
5.3.1. Example: Identifying Communities Disproportionately Affected by Environmental Hazards
An environmental advocacy organization suspects certain neighborhoods face higher air pollution due to industrial proximity. They aim to show these neighborhoods are predominantly minority or low-income, highlighting environmental injustice. Geospatial analysis provides spatial evidence for policy change or community action.
5.3.2. Data Sources and ArcGIS Application
Analysis integrates:
- Pollution Data: Air quality data, locations of polluting facilities, and major roadways from EPA and state agencies [23].
- Demographic Data: Racial/ethnic composition, income, and poverty rates at census tract/block group level from U.S. Census Bureau [17].
- Industrial Sites/Hazardous Waste Sites: Locations from EPA databases. ArcGIS analysis:
- Proximity Analysis (Buffer Analysis): Identifies residential areas within a certain distance of hazards [24].
- Overlay Analysis: Visually identifies areas where high pollution coincides with high concentrations of minority or low-income populations.
- Density Mapping: Highlights areas with high concentrations of environmental burdens.
- Spatial Statistical Analysis: Uses hot spot analysis to identify statistically significant clusters of pollution exposure, correlating with demographics [25].
- Environmental Risk Mapping: Combines hazard and vulnerability data to create comprehensive risk maps.
5.3.3. Impact on Social Justice Initiatives
Geospatial analysis findings are critical for environmental justice:
- Advocacy and Policy Change: Spatial evidence supports stricter regulations, facility relocation, or mitigation measures.
- Community Empowerment: Maps empower communities to understand risks, organize, and demand action.
- Litigation Support: Provides crucial evidence in environmental justice lawsuits.
- Resource Prioritization: Agencies use analyses to prioritize clean-up and health interventions for vulnerable populations.
For example, GIS analysis might show low-income, African American populations living near multiple industrial facilities emitting hazardous pollutants, while wealthier neighborhoods are unaffected. This disparity drives air quality monitoring and community-led planning, demonstrating ArcGIS’s role in environmental justice.
Beat Your Deadline
Hire a Writer Today!
✅ Get Your Assignment Done by Experts
Challenges and Ethical Considerations
While geospatial analysis offers immense potential for social justice, its application has challenges and ethical considerations. Addressing these ensures responsible and effective GIS use, avoiding inadvertent perpetuation of inequalities or compromise of rights.
6.1.Data Limitations and Bias: Availability, Accuracy, and Representation
Geospatial analysis quality depends on data. Challenges include:
- Data Availability: Comprehensive data on social determinants, educational outcomes, or environmental hazards may be scarce, especially for specific areas or marginalized populations.
- Data Accuracy and Resolution: Accuracy of geographic data and resolution of socioeconomic data impact reliability. Inaccurate data leads to misleading conclusions.
- Representational Bias: Data can carry inherent biases (e.g., crime data reflecting policing patterns). Biased data can amplify existing inequalities [26].
- Modifiable Areal Unit Problem (MAUP): Statistical results vary based on how geographic areas are defined, making conclusions challenging [27].
6.2. Privacy Concerns: Protecting Sensitive Individual Data
Linking individual data with geographic locations raises privacy concerns, especially for vulnerable populations:
- Anonymization and Aggregation: Aggregating data protects privacy, but re- identification risk exists. Balancing granularity and privacy is a challenge.
- Data Security: Secure storage and transmission of sensitive data are paramount.
- Ethical Use of Location Data: Real-time location data raises dilemmas regarding surveillance, consent, and discriminatory targeting.
6.3. Misinterpretation of Data: Ensuring Responsible Communication of Findings
Maps and spatial analyses are powerful but can be misinterpreted:
- Oversimplification: Complex social issues can be oversimplified, obscuring nuanced factors.
- Ecological Fallacy: Drawing individual conclusions from aggregated data can lead to stereotypes.
- Visual Manipulation: Maps can mislead through design choices (color, classification, scale). Responsible cartography requires transparency.
- Lack of Context: Presenting spatial data without qualitative context can lead to ineffective interventions.
6.4. Digital Divide: Access to Technology and GIS Literacy
Equitable access to technology and skills is crucial. The digital divide poses challenges:
- Access to Software and Hardware: Expensive GIS software and powerful computers limit access for grassroots organizations.
- GIS Literacy and Training: Specialized training is needed. Lack of literacy hinders adoption and effective use for social justice.
Addressing these requires robust data collection, ethical guidelines, GIS education, and interdisciplinary collaboration. Only then can geospatial analysis truly serve equity and justice.
The Future of Geospatial Analysis in Social Justice
Geospatial analysis is continuously evolving, driven by technological advancements and its potential to address complex societal challenges. Its future in social justice promises significant growth through integrated technologies, collaborative approaches, and direct policy impact.
7.1. Emerging Technologies: AI, Machine Learning, Real-time Data
- The convergence of geospatial technology with AI and ML will revolutionize social inequality analysis:
- Enhanced Predictive Analytics: AI/ML can process vast geospatial data to identify patterns and predict where disparities will emerge, enabling proactive intervention.
- Automated Feature Extraction: AI-powered image recognition automates feature extraction from satellite imagery, providing data for areas where traditional collection is challenging.
- Real-time Data Integration: IoT, social media, and mobile sensors generate real-time geospatial data. Integrating this allows near real-time monitoring of social conditions, enhancing responsiveness of social justice initiatives.
- Natural Language Processing (NLP) for Qualitative Data: NLP extracts geographic information and sentiment from unstructured text, linking qualitative insights to locations for richer understanding.
7.2. Collaborative Approaches: Community Engagement and Participatory GIS (PGIS)
Future geospatial analysis will emphasize collaborative approaches, involving communities directly in data processes:
- Participatory GIS (PGIS): Empowers local communities to create and utilize their own geographic information, integrating local knowledge and lived experiences for effective solutions [28].
- Citizen Science: Engaging citizens in data collection (e.g., via mobile apps) expands data coverage and raises public awareness.
- Interdisciplinary Collaboration: Crucial collaboration between GIS professionals, social scientists, and community organizers ensures technical expertise combines with contextual understanding.
7.3. Policy Implications: Informing Evidence-Based Decision-Making
As geospatial analysis advances, its role in informing evidence-based policy for social justice will expand:
- Targeted Policy Interventions: Identifying affected areas/populations allows for highly targeted interventions, maximizing resource impact.
- Equity-Focused Planning: Geospatial tools integrate into urban planning to assess equity implications of projects proactively.
- Performance Monitoring and Accountability: Geospatial dashboards monitor progress towards social equity goals, fostering transparency.
- Legal and Advocacy Support: Geospatial evidence plays a vital role in legal challenges and advocacy campaigns.
The future of geospatial analysis in social justice is bright, promising precise, participatory, and impactful interventions. By harnessing location intelligence, societies can achieve true equity, ensuring opportunities and resources are accessible to all. Technology’s role in fostering a more equitable society is undeniable, and geospatial analysis exemplifies its potential for meaningful social change.
Beat Your Deadline
Hire a Writer Today!
✅ Get Your Assignment Done by Experts
Full References on Geospatial Analysis of Social Inequality
[1]The Pachamama Alliance. (n.d.). Social Inequality. https://pachamama.org/social- justice/social-inequality
[2]KFF. (2024, June 11). Key Data on Health and Health Care by Race and Ethnicity. https://www.kff.org/key-data-on-health-and-health-care-by-race-and-ethnicity/
[3]UNCF. (n.d.). Education Inequality: K-12 Disparity Facts. https://uncf.org/pages/k-12- disparity-facts-and-stats
[4]The Education Trust. (2022, December 8). School Districts That Serve Students of Color Receive Significantly Less Funding. https://edtrust.org/press-room/school-districts-that- serve-students-of-color-receive-significantly-less-funding/
[5]CDC. (n.d.). FastStats – Access to Health Care. https://www.cdc.gov/nchs/fastats/access- to-health-care.htm
[6]National Equity Atlas. (n.d.). Housing Insecurity. https://nationalequityatlas.org/indicators/Housing-insecurity
[7]The Engine Room. (2023, November 2). Understanding the Impact of Geospatial Data in Social and Climate Justice. https://www.theengineroom.org/library/understanding-the- impact-of-geospatial-data-in-social-and-climate-justice/
[8]ScienceDirect. (n.d.). Geospatial analysis for promoting urban green space equity. https://www.sciencedirect.com/science/article/abs/pii/S1618866725000500
[9]Esri. (n.d.). What is GIS?. https://www.esri.com/en-us/what-is-gis/overview
[10]Esri. (n.d.). Geospatial Data Analytics: What It Is, Benefits, and Top Use Cases. https://www.safegraph.com/guides/geospatial-data-analytics
[11]Esri. (n.d.). Racial Equity and Social Justice. https://www.esri.com/en-us/racial- equity/overview
[12]Esri. (n.d.). Introduction to Social Equity Analysis—ArcGIS Solutions. https://doc.arcgis.com/en/arcgis-solutions/latest/reference/introduction-to-social-equity- analysis.htm
[13]Esri. (2024, October 4). Trends in Health GIS: Mapping Healthcare Accessibility. https://www.esri.com/en-us/industries/blog/articles/trends-in-health-gis-mapping- healthcare-accessibility
[14]ArcGIS StoryMaps. (n.d.). GIS for Racial Equity & Social Justice: Overview. https://storymaps.arcgis.com/stories/8ac07543bee24d5b8af3b31a81a925f7
[15]CDC. (n.d.). About Health Equity. https://www.cdc.gov/healthequity/about/index.html
[16]KFF. (2024, June 11). Key Data on Health and Health Care by Race and Ethnicity. https://www.kff.org/key-data-on-health-and-health-care-by-race-and-ethnicity/
[17]U.S. Census Bureau. (n.d.). Health Data. https://www.census.gov/topics/health/data.html
[18]National Center for Education Statistics. (n.d.). Condition of Education (COE) Home. https://nces.ed.gov/programs/coe/
[19]U.S. Census Bureau. (n.d.). Education Data. https://www.census.gov/topics/education/data.html
[20]Education Law Center. (n.d.). Making the Grade. https://edlawcenter.org/research/making-the-grade-2023/
[21]SciSpace. (n.d.). A Case Study: Using Geographic Information Systems for. https://scispace.com/pdf/case-study-using-geographic-information-systems-for- 3irnc73s5s.pdf
[22]U.S. Environmental Protection Agency. (n.d.). Environmental Justice. https://www.epa.gov/environmentaljustice
[23]U.S. Environmental Protection Agency. (n.d.). Interactive Map of Air Quality Monitors. https://www.epa.gov/outdoor-air-quality-data/interactive-map-air-quality-monitors
[24]Esri. (n.d.). Calculating Disparities in Pollution Exposure Using ArcGIS. https://www.esri.com/training/catalog/6410c0744d750615175c0f16/calculating-disparities- in-pollution-exposure-using-arcgis/
[25]Nature. (2022, January 12). Air pollution exposure disparities across US population and income groups. https://www.nature.com/articles/s41586-021-04190-y
[26]The Engine Room. (2023, November 2). Understanding the Impact of Geospatial Data in Social and Climate Justice. https://www.theengineroom.org/library/understanding-the- impact-of-geospatial-data-in-social-and-climate-justice/
[27]Esri. (n.d.). What is the Modifiable Areal Unit Problem (MAUP)?. https://www.esri.com/arcgis-blog/products/arcgis-pro/analytics/what-is-the-modifiable- areal-unit-problem-maup/
[28]Simon Fraser University Library. (n.d.). Using mapping/GIS for community-based research, participatory projects, and equity/diversity-related issues. https://www.lib.sfu.ca/find/other-materials/data-gis/gis/community-research
Figure 1: Conceptual Diagram of GIS Layers for Social Inequality Analysis
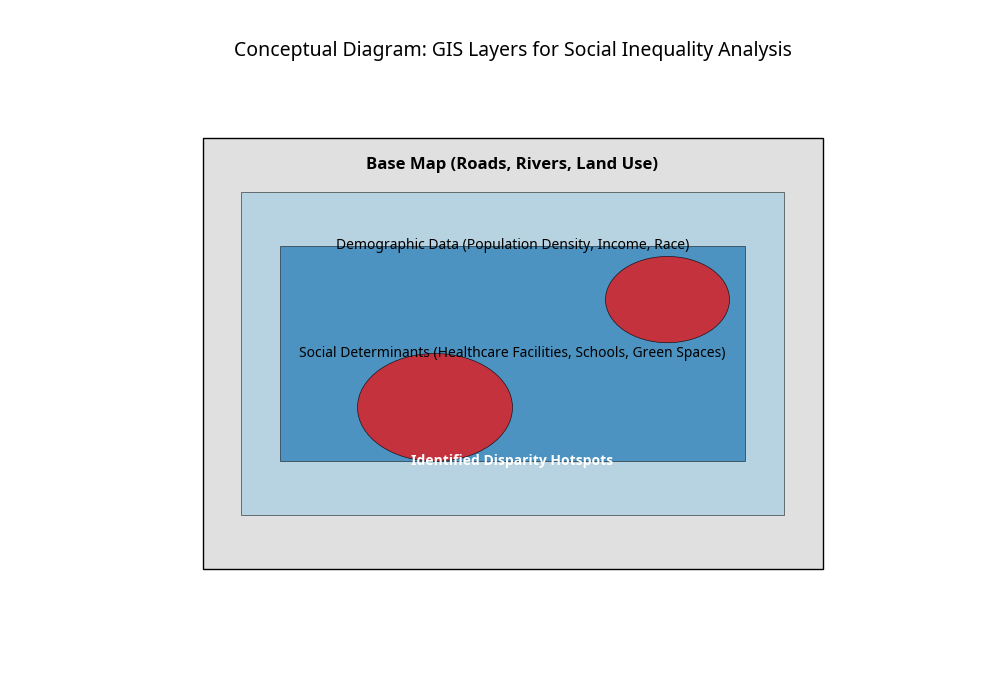
Figure 1 illustrates how different layers of geographic information are combined within a GIS to reveal patterns of social inequality. A base map provides foundational geographic context, upon which demographic data (e.g., population density, income levels) and social determinants (e.g., locations of healthcare facilities, schools, green spaces) are overlaid.
Through spatial analysis, areas where these layers intersect to indicate significant disparities, or ‘hotspots’ of inequality, can be identified.
Figure 2: Hypothetical Healthcare Access by Income Group
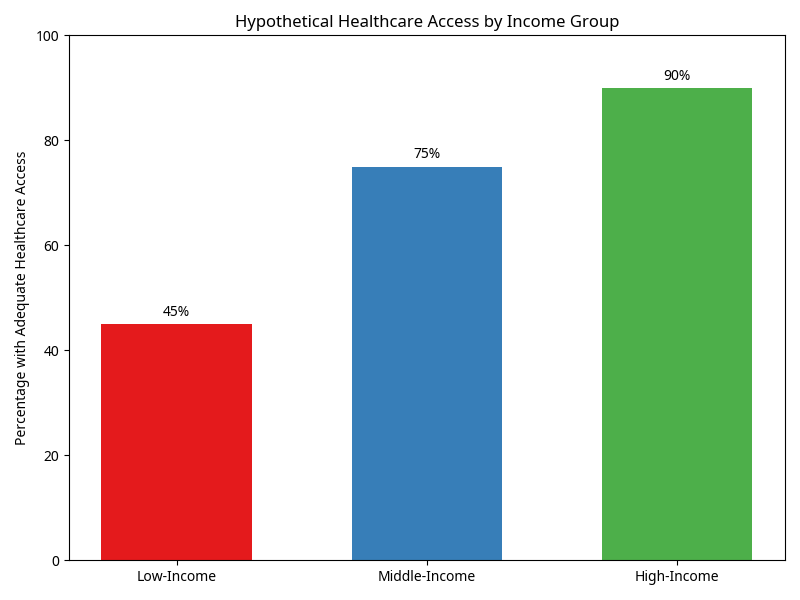
Figure 2 presents a hypothetical bar chart illustrating disparities in healthcare access across different income groups. This type of visualization, often generated using data analyzed in ArcGIS, clearly demonstrates how lower-income populations may have significantly less access to adequate healthcare services compared to their higher-income counterparts. Such a graph provides compelling evidence for the existence of health inequities and underscores the need for targeted interventions.
Figure 3: Hypothetical Relationship Between Per-Pupil Spending and Graduation Rates
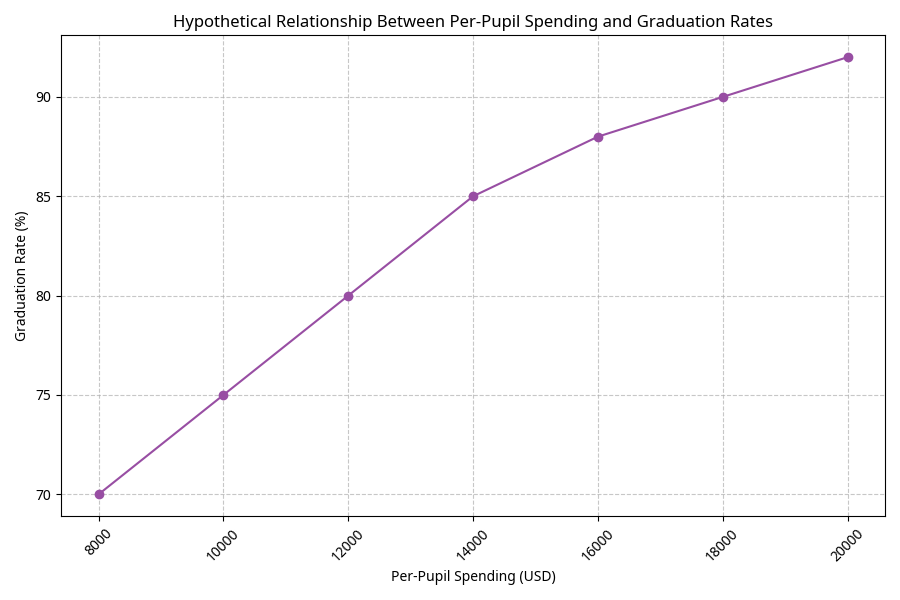
Figure 3 illustrates a hypothetical positive correlation between per-pupil spending and graduation rates. This type of visualization can be generated using spatial regression analysis in ArcGIS, where educational outcomes are analyzed in relation to financial inputs across different school districts. Such a graph provides visual evidence supporting arguments for increased and equitable funding to improve educational attainment in underserved areas.
Addressing these requires robust data collection, ethical guidelines, GIS education, and interdisciplinary collaboration.
The future of geospatial analysis in social justice promises significant growth through integrated technologies and collaborative approaches.
Addressing these requires robust data collection, ethical guidelines, GIS education, and interdisciplinary collaboration.
The future of geospatial analysis in social justice promises significant growth through integrated technologies and collaborative approaches.
Leave a Reply to First Time Tips to Pass CIPD Assignment : CIPD Help Cancel reply